Practical Background
Our intuition will tell us that sharp or rounded objects will cause less drag when moving through fluid. Slightly less intuitive is the fact that changing the rear part will reduce drag even more than changing the front.
So why is it that on cars and trucks, all drag-reducing effort is being put into the front but the backs are still blunt or even flat?
As far as cars go, there have been streamlined attempts (like this tatra) but very quickly shapes get pretty weird and useless (like this tatra).
On trucks, the story is quite similar. Besides the argument about usability there are a couple more plot twists.
Firstly, with cars, higher speeds and lower weights mean most of the fuel consumption (80%) is caused by air drag. On trucks, lower speeds and higher weights mean that this ratio can fall to as low as 50%. This means reducing drag on trucks will have less effect than on cars.
The second argument is rather silly but very real. It’s about semi-trailers. Those trucks often consist of a tractor that is owned by the hauling company and a trailer that is the property of another company. The latter will not invest in their trailers so that haulers will benefit from fuel savings. See this report on drag reduction, page 8: Tractor and Trailer add-on Devices (here’s a saved version in case the link breaks).
The Idea
Let’s suppose changing the back of a trailer really does drastically reduce truck drag. If that is so, could we create a simple device that attaches to the back of a standard trailer before the haul and then gets removed at the end?
This device could be as simple as a balloon. The hauler would attach it to the back and inflate it. Actually, the term as simple as a balloon is not very accurate. Have a look at this simple article about baloons (and a saved version of a priceless piece of science).
The Simulation
But by how much exactly can drag be reduced?
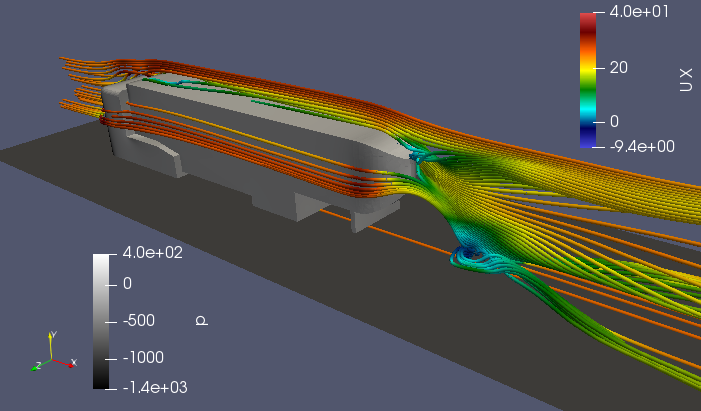
I quickly sketched a so-called Generic Conventional Model of a semi-truck and ran a few OpenFOAM simulations with it.
In the first case, it’s just a truck with nothing added. There is a huge vortex behind the blunt trailer. It’s very random/unstable and so my steady-state simulation never converged but drag figures stabilized. I got a drag coefficient of 0.62-0.63, which approximately matches the value from Wikipedia – though it’s almost certainly not accurate, it’s an indicator that simulation isn’t a total blunder.
Then I tried with a butt-like ending. Not only it made no improvement, it also looks very silly. I’m not showing you that one.

Then, a wedged end. A slight but not significant improvement.

Then, a spherical end. This lowered drag coefficient from 0.62 to 0.52.

The Numbers
So what does lowering drag coefficient from 0.62 to 0.52 actually mean?
Take a fully loaded semi truck travelling at 90 km/h on a highway. It weighs about 35 tons and has drag coefficient of 0.62 and coefficient of rolling resistance of 0.006. The engine must overcome resistance force (2060 N) and drag (2035 N).
Now add our little thingamabob and reduce drag to 0.52. Drag force is now 1706 N and the overall pulling force is 8% lower from previous case.
If the original truck used 40 liters of fuel per 100 km (the average for heavy trucks is, according to Wikipedia, 41 l/100 km), we could save 3.3 liters per 100 km. Heavy trucks often haul over 1000 km. How about saving 50€ for inflating a balloon within a couple of minutes?
Also keep in mind that with lighter truck fuel consumption is lower but drag is more important. So savings could be greater but again distances traveled with smaller trucks are also shorter.
In the end, it is probably not that simple (because it really never is). I might have missed an important fact that ruins everything or my calculations might be off by an order of magnitude.
Anyway, it was fun to play with OpenFOAM. I will leave the rest as an exercise to the student.


